Top Tax Rate Already at Average Earnings? What the Figures Really Show

September 29, 2026
Sometimes a graphic tells a story that sounds almost too spectacular to be true.
This is one of them.
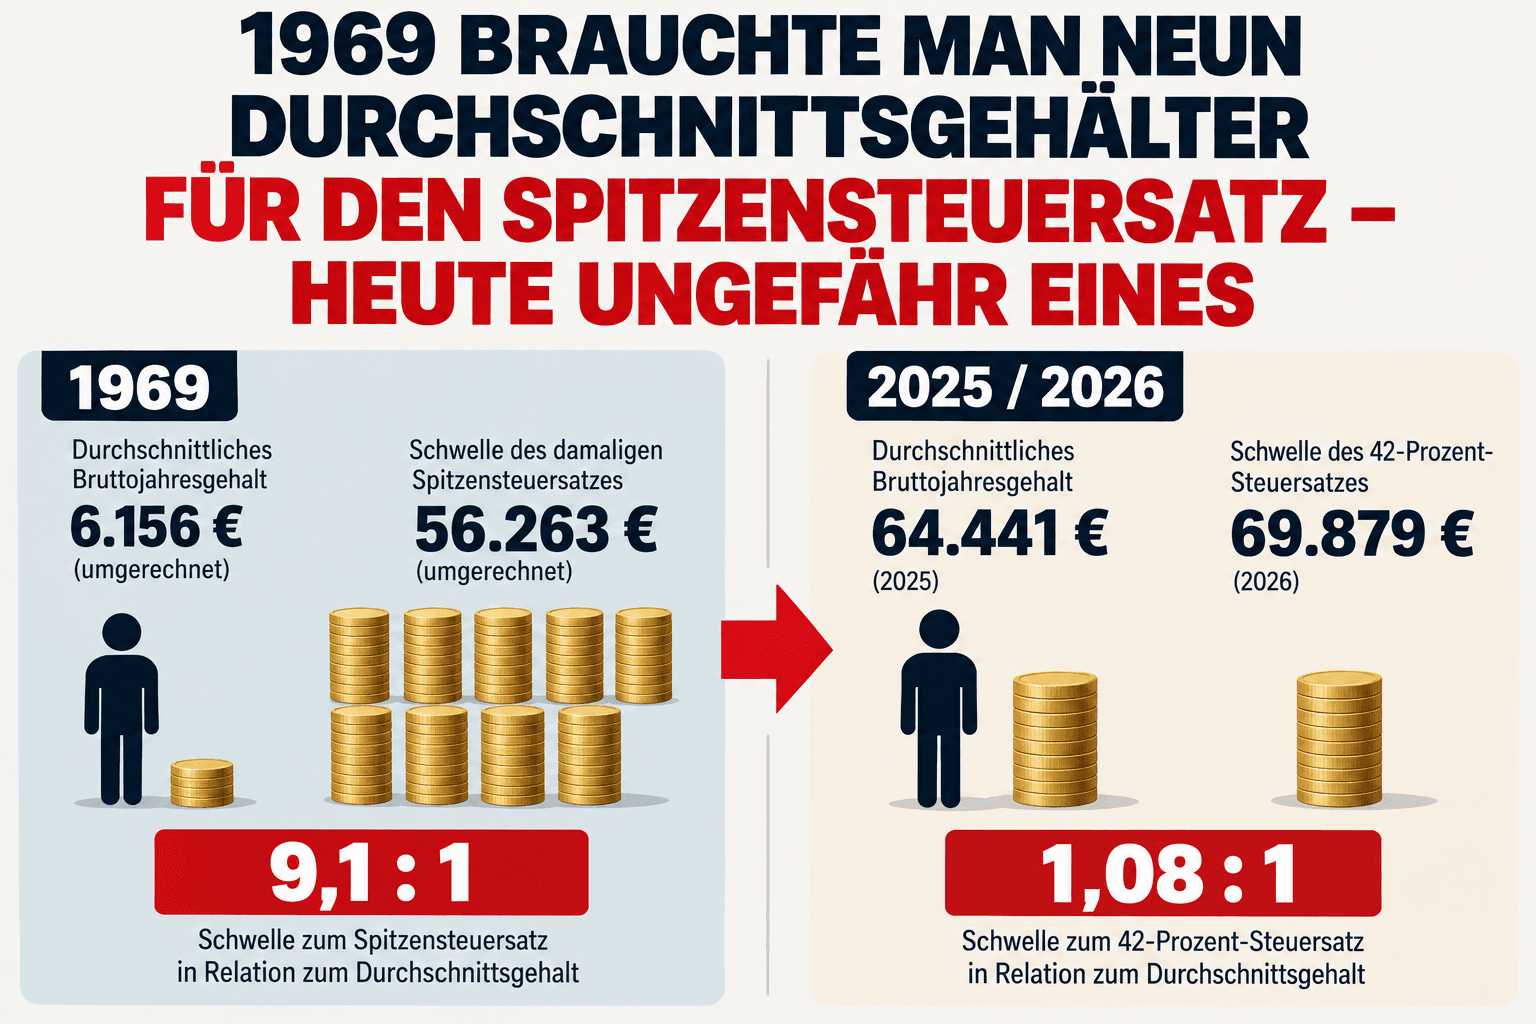
1969:
Average annual gross salary:
6,156 euros – converted.
Threshold of the top tax rate at the time:
56,263 euros.
Ratio:
And today?
The graphic published by The Pioneer and Statista cites an average annual gross salary for 2025 of:
64,441 euros.
According to the graphic, the threshold for the 42 percent tax rate in 2026 is:
69,879 euros.
Ratio:
Thus, nine average salaries have become – at least in this comparison – approximately one.
That sounds like a massive hidden tax increase.
But the story is not quite that simple.
This is crucial.
The average salary is a:
gross income.
In contrast, the income tax tariff is applied to the:
taxable income
applied.
Between the two lie, for example, professional expenses and deductible pension contributions.
An employee with a gross salary of 69,879 euros therefore usually does not have a taxable income of 69,879 euros.
The claim:
"The average earner today pays the top tax rate"
is therefore misleading.
But dismissing the graphic for that reason would be equally wrong.
Because the long-term trend remains remarkable.
In 1969, an income had to be exceptionally far above the average before the top tax rate of the time was reached.
Today, the 42 percent marginal tax rate already begins in an income region that by no means affects only classic top earners.
And exactly here lies the political and economic question:
Someone with nine times the average income?
Three times?
Double?
Or approximately the average gross salary?
The answer to this is not a mathematical one.
It is political.
No.
This is a common misunderstanding.
The top tax rate is a:
marginal tax rate.
A simplified example:
If the 42 percent zone starts at around 70,000 euros of taxable income and someone has 71,000 euros of taxable income, not all 71,000 euros are suddenly taxed at 42 percent.
The higher marginal tax rate only affects the corresponding upper part of the income.
The average tax rate on the total income remains lower.
That is a significant difference.
And this is where the original thesis becomes interesting.
Imagine:
An employee earns 50,000 euros.
Prices rise by 5 percent.
His employer also increases his salary by 5 percent.
Now he earns:
52,500 euros.
In real terms, however, he has not become wealthier.
His purchasing power has merely remained approximately the same.
If the tax tariff remains unchanged, his average tax rate can still increase.
He then has:
nominally more income – but in real terms no more wealth.
This is exactly what is referred to as:
The Federal Ministry of Finance formulates remarkably clearly that one can also speak of a "tax increase through inaction" in this context. Federal Ministry of Finance
The claim that politicians have done nothing about it for 67 years is false.
Since 2015, the Federal Ministry of Finance has regularly published progression reports.
Since 2016, the tax bracket thresholds have been regularly adjusted.
In 2026, the tariff was again shifted to the right.
The basic tax-free allowance rose to:
12,348 euros.
The BMF explicitly explains that these measures are intended to compensate for bracket creep. Federal Ministry of Finance
What is interesting, however, is:
This regular systematic correction has only existed for about ten years.
The historical shift of the decades before does not automatically disappear as a result.
Let's take exclusively the logic of the Pioneer graphic.
In 1969, the threshold for the top tax rate was at:
9.14 times the average earnings.
If one wanted to maintain this ratio today, the corresponding limit for an average salary of 64,441 euros would have to be approximately:
This explicitly does not mean that 589,000 euros would be the "correct" tax policy limit.
It merely shows how fundamentally the ratio has changed.
In the widely circulated accompanying text to the graphic, it is stated that the limit should actually be around 300,000 euros today.
This also depends on the calculation.
Extrapolation with consumer prices?
Average wages?
Median wage?
Productivity?
Overall economic income development?
Depending on the benchmark, different results are obtained.
Therefore, one should not construct a false sense of precision from an interesting historical graphic.
Rather, the robust statement is:
That alone is remarkable enough.
Why does this topic interest us at Spargold?
Not because gold avoids income taxes.
It does not.
And certainly not because precious metals would be a tax policy solution.
Rather, the mechanism behind the graphic is interesting.
In 1969:
6,156 euros
were an average income.
Today, more than:
60,000 euros
are necessary to reach a comparable nominal magnitude of today's average income.
Of course, the standard of living and economic performance are also completely different today.
But the figures make visible how much the unit of measurement "money" changes over decades.
This is perhaps the most important connection between taxes, inflation, and wealth accumulation.
People often think in nominal terms.
My salary has increased.
My house is worth more.
My portfolio is larger.
My bank balance has increased.
But the relevant question is:
An asset that doubles in 20 years has not necessarily made its owner twice as rich.
If the price level increases accordingly in the same time, the real growth in wealth can be significantly smaller.
Gold does not produce cash flow.
It pays no interest.
Its price fluctuates, sometimes considerably.
But physical gold possesses a special property:
It is not a claim against a debtor.
And its quantity cannot be increased through monetary policy decisions in the same sense as the money supply of a currency.
Therefore, gold has been used for centuries as a form of long-term asset diversification.
Not as protection against a specific income tax tariff.
But as a possible building block against another risk:
Not:
"For 67 years, politics has been secretly cheating us."
That cannot be derived from the data.
But certainly:
Nominal incomes can rise sharply without the boundaries between the middle and the top remaining unchanged.
And:
Over decades, inflation does not only change prices. It also changes the meaning of nominal figures.
In 1969, 56,263 euros – converted – was an income level far outside the average.
Today, a figure of this magnitude is right in the middle of the labor market.
This should remind us:
Stay far-sighted.
Yours,
Helge Peter Ippensen