Summary: Copper rally or gold boom? All three metals — gold, silver, and copper — are performing strongly in 2026, but for fundamentally different reasons. Gold is trading at 4,149 USD/oz (+8% YTD), silver at 61 USD/oz (+30% YTD), and copper at approximately 9,800 USD/t (+25% YTD). Analysts see the greatest percentage potential in copper, with forecasts of up to 14,500 USD/t (UBS) — driven by electromobility, AI data centers, and structural supply deficits. As of: September 28, 2026.
Before diving into the price forecasts, it is worth taking a fundamental look at what these three metals actually are — and why they should not be lumped together. Gold and silver share a millennia-old history as currency and stores of value. Central banks worldwide store tons of gold — according to the World Gold Council, central banks again purchased over 1,000 net tons in 2025, a trend that continues seamlessly into 2026. Gold is the classic safe haven: in times of geopolitical uncertainty, high national debt, and growing doubts about fiat currencies, capital flows into the yellow metal.
Silver is often underestimated by investors as "poor man's gold" — yet the reality is significantly more complex: more than half of global silver demand today comes from industry, particularly from solar panel manufacturing, electronics, and the automotive industry. The Silver Institute reports that industrial demand reached a record high of over 700 million ounces in 2025. Every photovoltaic panel requires between 15 and 20 grams of silver as a conductive coating.
Copper, on the other hand, is a blunt industrial metal. The red wires that electrify every home, the cooling systems in data centers, the windings in electric motors, the cable harnesses in electric cars — copper is everywhere. It is the electrical backbone of modern civilization.
| Metal | Price (09/28/2026) | Annual Performance | Avg. Analyst Target | Highest Target |
|---|---|---|---|---|
| Gold | 4,149 USD/oz | +8.24 % | 4,900–5,000 USD/oz | 6,000 USD/oz (J.P. Morgan) |
| Silver | 61.06 USD/oz | +30.14 % | 65–75 USD/oz | 80 USD/oz (Consensus) |
| Copper | approx. 9,800 USD/t | approx. +25 % | 11,000–12,000 USD/t | 14,500 USD/t (UBS) |
What the table clearly shows: all three metals have performed strongly in 2026 — yet the starting positions and forecasts are fundamentally different. Gold has increased in price but remains a defensive investment. Silver has significantly outperformed gold and offers an attractive combination of precious metal and industrial asset. And copper? The percentage analyst targets in some cases significantly exceed those of the precious metals.
At 4,149 US dollars per ounce, gold is trading below its annual highs but remains at historically high levels. Two years ago, the yellow metal was at around 2,500 US dollars per ounce — the performance since then has been impressive. J.P. Morgan considers a year-end target of 6,000 US dollars possible — which would represent a further increase of around 45 percent. HSBC and Bank of America have issued forecasts of 5,000 US dollars each, while Goldman Sachs expects 4,900 dollars per ounce.
Gold is likely to maintain its role as the ultimate safe haven in an increasingly multipolar world. The upside potential is lower in percentage terms than for copper — however, the risk profile is also significantly more defensive. For investors primarily looking to preserve wealth rather than achieve maximum returns, physical gold remains the top choice. Read more in the Spargold Glossary on Precious Metals.
With an annual gain of over 30 percent, silver has impressively proven this year that it is far more than just gold's little brother. The gold-silver ratio currently stands at 67.8 — historically, a value that makes silver appear relatively cheap compared to gold. In previous metal boom phases, this ratio has sometimes fallen below 30. At a ratio of 67.8, you get nearly 68 ounces of silver for the same price as one ounce of gold.
Bank of America has issued a forecast of 65 US dollars per ounce, while the market consensus for the end of 2026 lies between 70 and 80 dollars — representing a further increase of 15 to 30 percent compared to the current price.
| Metal | Bear Scenario | Base Scenario | Bull Scenario |
|---|---|---|---|
| Gold | 3,500–4,000 USD/oz | 4,500–5,000 USD/oz | 5,500–6,000 USD/oz |
| Silver | 45–55 USD/oz | 65–75 USD/oz | 80–100 USD/oz |
| Copper | 8,000–9,000 USD/t | 11,000–12,000 USD/t | 14,000–15,000 USD/t |
Sources: Goldman Sachs, UBS, J.P. Morgan, Bank of America, Heraeus (forecasts September 2026). The bear scenario assumes an economic slowdown and a stronger US dollar. The bull scenario relies on continued interest rate cuts and accelerated expansion of energy infrastructure.
Gold, silver, and copper are all three interesting in 2026 — but for completely different reasons. Gold is and remains the timeless store of value with strong fundamental tailwinds from central bank purchases and de-dollarization. Silver combines precious metal security with industrial potential. Copper is the industrial dynamo of a world that needs more electricity, more electromobility, and more data centers than ever before.
Copper has the greatest percentage price potential according to analysts — UBS sees up to 14,500 US dollars per ton. However, it should be noted: copper is not a classic safe-haven investment and not a store of value in the historical sense. Those wishing to rely on physical precious metals that have served as stores of value for centuries are better advised to choose gold and silver. Buy and save physical gold and silver: Further articles in the Spargold Blog.
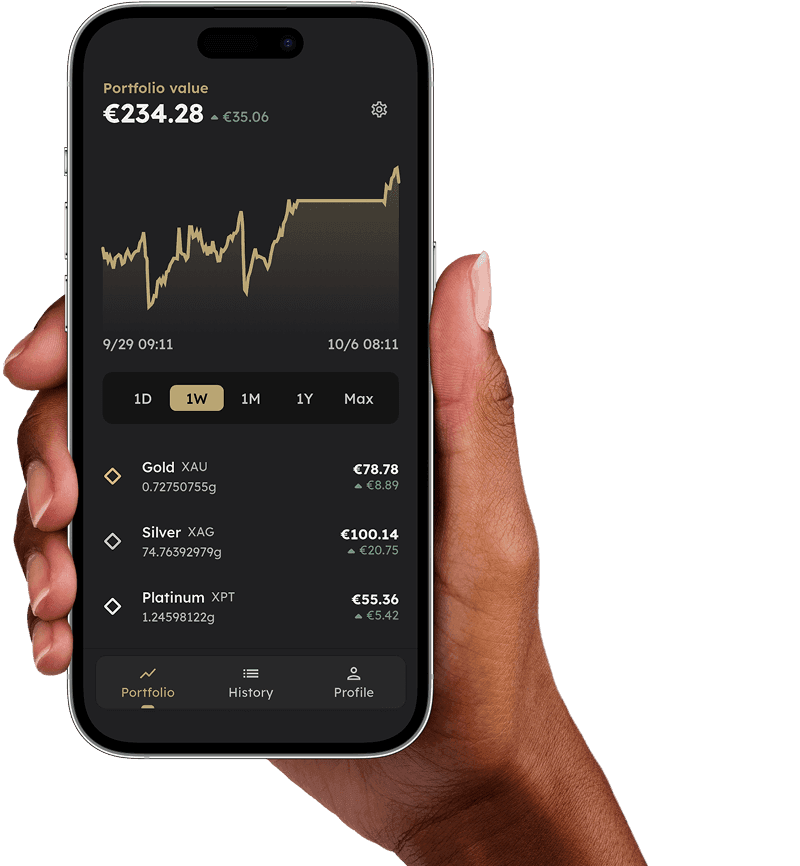
Ready to invest in physical precious metals? Start today with Spargold — simple, secure, starting from small amounts. Download the app.
No. Spargold specializes in physical precious metals — namely gold and silver. Copper is an industrial metal and is not offered at Spargold.
The main drivers are the energy transition (electric vehicles require 60–100 kg of copper), the expansion of AI data centers, and structural supply deficits, as new mines require 10–15 years of lead time.
The gold-silver ratio shows how many ounces of silver you get for one ounce of gold. It currently stands at 67.8 — historically a value that makes silver appear relatively cheap in relation to gold.
In percentage terms, copper leads: UBS sees potential up to 14,500 USD/t (currently approx. 9,800 USD/t). Measured in absolute terms and security, gold remains the more stable choice as a store of value.
All price information refers to the status as of September 28, 2026. This article is for informational purposes only and does not constitute investment advice. Investments in commodities and precious metals involve risks.