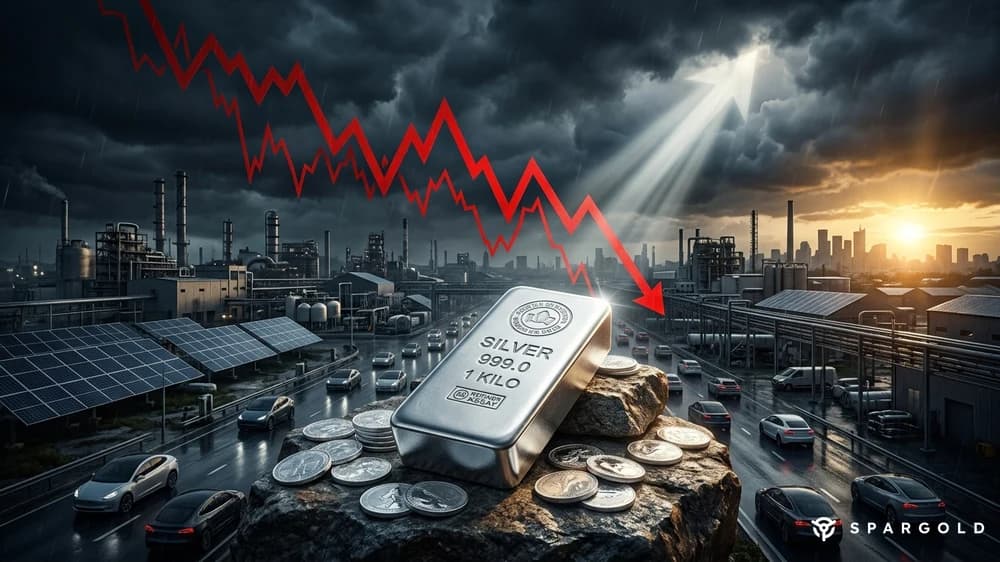
Silver is the precious metal with the sharpest pullback: from an all-time high of 121 USD in January 2026 to around 61 USD in October 2026 — a decline of nearly 49 percent in less than nine months. Anyone looking to buy silver faces a significantly more complex evaluation process than with gold: because silver is both a precious metal and an industrial metal, and it is precisely this dual nature that makes it more difficult to assess. This article lays the facts on the table.
Major banks' forecasts for silver are more widely spread than for gold — and show more uncertainty. Goldman Sachs sees silver at 85 to 100 USD by the end of 2026. UBS considers 70 USD by December 2026 and 80 USD by the end of 2027 to be realistic. JPMorgan revised its forecast downward by 26 percent in September 2026 — to 63 USD for the fourth quarter of 2026 — a sign that even the largest US institution was surprised by the strength of the pullback.
At the other end of the forecast scale is Standard Chartered at 38 USD — representing a further decline of around 38 percent from today's level. This is the most conservative among the major banks. The range between Goldman (85 to 100 USD) and Standard Chartered (38 USD) illustrates how far apart the assessments are — and why silver is not an investment for investors who prioritize safety above all else.
The Silver Institute published a sobering supply forecast for 2026: The deficit between demand and production is expected to be 46 million troy ounces — the sixth consecutive deficit year, 15 percent more than the previous year (40 million troy ounces). Since 2021, a cumulative 762 million ounces have been drawn down from global silver inventories.
Total supply in 2025 was 1,090 million ounces (+7 percent), of which 847 million came from mine production. Mine production in 2026 is stagnating at around 844 million ounces — supply can hardly grow in the short term because silver is primarily produced as a by-product of copper, lead, and zinc mining. New pure silver mines take years to reach production.
Structurally, this means: Six consecutive deficit years amid shrinking inventories are fundamentally bullish — regardless of short-term price pressure from interest rates and the dollar.
Silver is a crucial raw material in the energy transition — and that was a key reason for the rise to 121 USD. However, in 2026, this trend is partially reversing. The photovoltaic industry is consuming less silver per module: modern TOPCon solar cells only require around 15 to 20 grams of silver per panel, compared to 30 to 40 grams previously. And manufacturers are increasingly testing copper as a replacement for silver in cell metallization.
Solar silver demand in 2025 was 187 million ounces — about 17 percent of total demand. For 2026, the industry expects a decline of 19 percent to around 151 million ounces. This is a real headwind: the largest single demand sector is shrinking. The EV sector compensates for part of this — around 70 to 75 million ounces of demand for 2026 — but not entirely.
In the long term, solar and e-mobility remain bullish for silver. In the short term, "de-silvering" in solar cells is a genuine pressure factor.
The gold-silver ratio is a classic valuation tool: it shows how many ounces of silver can be bought with one ounce of gold. Currently, it stands at around 68. The long-term average since 1971 is around 60. The historical range spans from 50 to 90.
This means: relative to gold, silver is currently about 13 percent cheaper than the historical average would suggest. If the ratio were to return to its mean of 60 — with a constant gold price — silver would be fairly valued at around 70 USD. At the all-time high in January 2026, the ratio briefly fell below 40, representing an extremely expensive valuation of silver compared to gold.
The ratio alone is not a timing signal. But it shows: for those who invest in precious metals long-term and wish to hold both, silver is at an attractive level relative to gold.
The technical picture for silver is more clearly bearish than for gold: the 200-day moving average was breached for the first time since April 2025 — a signal that chart-oriented investors interpret as a trend reversal. The next strong support lies at the current year-to-date low zone around 61 USD, followed by 55 USD (from the October/November 2025 highs) and, in a negative scenario, the 46-dollar mark.
The immediate trigger for the latest slump was a US services PMI below expectations — a recession signal. Silver suffers doubly from growth concerns: once as a precious metal (like gold), and once as an industrial metal, because weaker economic growth depresses industrial demand.
Silver is riskier than gold but offers potentially more upside when the market picks up. The structural arguments are there: six deficit years, shrinking inventories, a gold-silver ratio below the historical average. However, the risks are also real: JPMorgan's surprising forecast cut, solar thrifting, the broken 200-day line.
For investors with a long time horizon and a tolerance for volatility, silver can make sense as an addition — not as a core investment. Those who already hold gold can consider a small silver allocation to benefit from a possible catch-up movement. Timing remains difficult — patience is the decisive variable.
On the gold pullback and bank forecasts: Buying Gold on the Dip: Opportunity or Risk?. On the silver price slump and interest rates: Silver Price −7%: When High US Interest Rates Put Pressure on Precious Metals.
Silver has a dual nature: it is a precious metal and an industrial metal. In phases of growth concerns and rising interest rates, silver suffers doubly — as a non-interest-bearing asset (like gold) and as an industrial raw material (due to falling industrial demand). This explains why the decline in silver is nearly 49 percent, while gold has lost around 25 percent.
Six consecutive deficit years mean that the market has consumed more silver than has been produced since 2021 — a total of around 762 million ounces. This is bullish in the long term: shrinking inventories increase price sensitivity to increases in demand. In the short term, however, this does not automatically cushion the price, as financial markets (futures, ETFs) react more quickly than the physical market.
This depends on the risk profile. Silver is more volatile than gold — it can rise more strongly in boom phases but also fall more sharply in downturns. For conservative investors, gold is the more stable choice. Those who accept higher volatility and believe in a recovery can consider silver as a speculative addition (5 to 10 percent of the precious metal allocation).
Solar thrifting refers to the process where solar cell manufacturers use less and less silver per module — through more efficient technologies (TOPCon instead of PERC) and increasingly through copper as a replacement material. In 2026, solar silver demand is falling by 19 percent. In the long term, this is a real headwind that weakens the "energy transition" demand driver for silver.
This article is for general information purposes only and does not constitute investment advice. Investing in precious metals involves risks. Please consult an independent financial advisor when making investment decisions.