Gold Price Below 3,900 USD: Worst October Since 2008

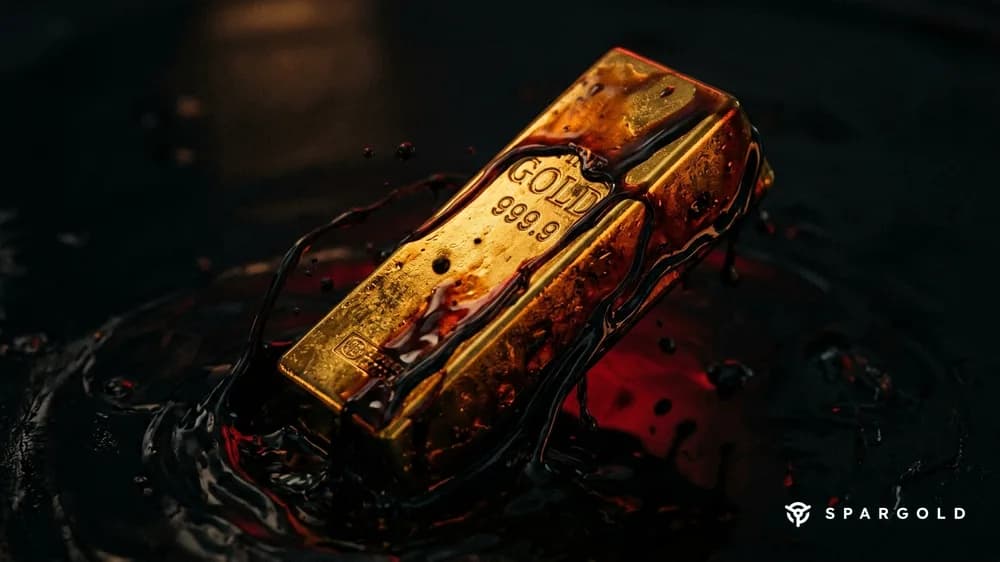
Gold price breaks below 3,900 USD on October 30, 2026, marking the worst October since the 2008 financial crisis — a decline of approximately 6% over the course of the month. Silver fell below 50 USD for the first time since November 2025. Analysts discuss: capitulation or buying opportunity?
The Slump in Figures
Spot gold (XAU/USD) fell to a daily low of 3,891 USD on October 30, 2026; gold futures were quoted at 3,884.90 USD during the day — the lowest level in a year (TradingKey). The October loss thus adds up to approximately 6% — according to XTB and Mining.com, the worst October for gold since 2008, when the global financial crisis shook the markets (XTB).
| Metric | Value | Source |
|---|---|---|
| Spot Gold Daily Low | 3,891 USD | TradingKey (30.10.2026) |
| Gold Futures Daily Close | 3,884.90 USD | CryptoTicker / Yahoo Finance |
| October Loss | ~6% | XTB / Mining.com |
| 2026 Yearly High | 5,379 USD | Macrotrends |
| Distance from Yearly High | approx. 28% | Macrotrends (30.10.2026) |
| Silver Spot | below 50 USD | CNBC (30.10.2026) |
Why 2026 Recalls 2008
The comparison with 2008 is not an alarm, but a statistical fact. The analysis firm BullionTrading has evaluated historical daily fluctuations for nearly three decades: during the 2008 financial crisis, gold recorded a daily decline of three percent or more on 18 days. In 2026, there were already 12 such trading days by the end of October — more than in any other year since 2008 (BullionTrading).
The decisive difference: 2008 was a systemic liquidity shock. 2026 is a monetary policy pincer movement — high interest rates make non-interest-bearing bonds (US Treasuries with yields around 5%) more attractive than the non-interest-bearing precious metal.
The Three Drivers of the Slump
1. Fed and Interest Rates: December Hike Almost Priced In
The US Federal Reserve kept the benchmark interest rate at 3.75–4.00% at its October meeting — but two committee members voted for an immediate increase of a quarter percentage point. The futures market currently sees a 74.9% probability of a further interest rate hike in December (FXStreet). Non-interest-bearing assets such as gold lose relative attractiveness in this environment.
2. PCE Inflation Higher Than Expected
The Fed's preferred inflation indicator — core PCE inflation — showed a further increase in September 2026 (Yahoo Finance). US Gross Domestic Product grew by 3.4% in the third quarter — significantly stronger than expected, increasing pressure on the Fed (Mitrade).
3. Oil and Stock Sell-off
Brent crude oil is trading up approximately 13% month-on-month at around 117 USD per barrel — an inflation driver that further fuels interest rate hike expectations. Simultaneously, losses in AI stocks and tech values weighed on US stock markets, which also triggered liquidation pressure on gold (CoinPaper).
Support Levels: Where Will Gold Hold?
| Level | Significance | Analysts / Source |
|---|---|---|
| 3,893 USD | Technical Support (LiteFinance model for November 2–3) | LiteFinance |
| 3,891 USD | Daily low Oct 30 — already tested | TradingKey |
| 3,900 USD | Psychological key level — now acting as resistance | FXStreet, StoneX, RoboForex |
| 4,000 USD | Next resistance after reclaiming | Goldreporter, FXStreet |
| 4,157 USD | Upper target upon recovery (LiteFinance resistance zone) | LiteFinance |
FXStreet and StoneX see 4,000 USD as the last major barrier before lower price targets — this level has now itself become a resistance zone. Goldman Sachs recently lowered its price target for the end of 2026 to 4,650 USD — following cuts from an original 5,400 USD (NAGA).
Historical Context: Buying Opportunity After October Slumps?
Data spanning more than a decade show: after a yearly low, the gold price rose in 54% of cases in the following 20 trading sessions. For silver, the rate was as high as 74% (Rio Times Online). These are statistical base rates — not a promise, but a historical reference value.
Three Scenarios for November
| Scenario | Requirement | Gold Reaction |
|---|---|---|
| Recovery | Fed communication becomes less hawkish, oil eases | Return above 4,000 USD, challenge of 4,157 USD |
| Sideways | No new data, market awaits Fed meeting | Consolidation between 3,900 and 4,000 USD |
| Further Decline | PCE data even worse, Fed signals multiple hikes | Test of the zone below 3,800 USD |
Frequently Asked Questions
Was the October slump in gold worse than in 2008?
No — in 2008, gold lost even more in phases. However, the October 2026 decline of around 6% is the sharpest October loss for the precious metal since the 2008 financial crisis. The number of days with price declines of three percent or more in 2026 is the highest of any year since 2008.
Is this a buying opportunity?
Historical data suggest that gold often recovers after yearly lows — but this is not investment advice. The framework conditions (high interest rates, strong dollar) remain unfavorable for gold as long as the Fed does not signal a pivot in interest rates.
Where are the next support zones for gold?
Technically speaking, 3,893 USD (LiteFinance model) and 3,891 USD (daily low from Oct 30) are the immediate levels. The 3,900 USD mark now serves as resistance from above. Below that, there are few significant supports in the chart until approximately 3,800 USD. Read more in the Spargold Glossary.
Sources
- XTB: Gold prices drop sharply at the end of October
- TradingKey: Spot Gold falls below key level
- Mining.com: Gold one-year low, silver breaks key support
- CoinPaper: Gold falls to one-year low as stocks plunge
- CryptoTicker: Gold futures decline
- BullionTrading: Gold biggest one-day crashes analysis
- LiteFinance: Gold forecast and support levels
- Rio Times Online: Gold and silver base rates
- NAGA: Goldman Sachs Gold Forecast
- FXStreet: Gold and PCE data analysis
- Mitrade: US GDP and PCE data
No investment advice. All information comes from publicly available sources and reflects the status as of October 31, 2026. Historical returns are no guarantee of future developments.
Ready to try Spargold?
Invest easily in physical precious metals.