Gold at a Low? Why the Time Horizon Changes the Whole Story

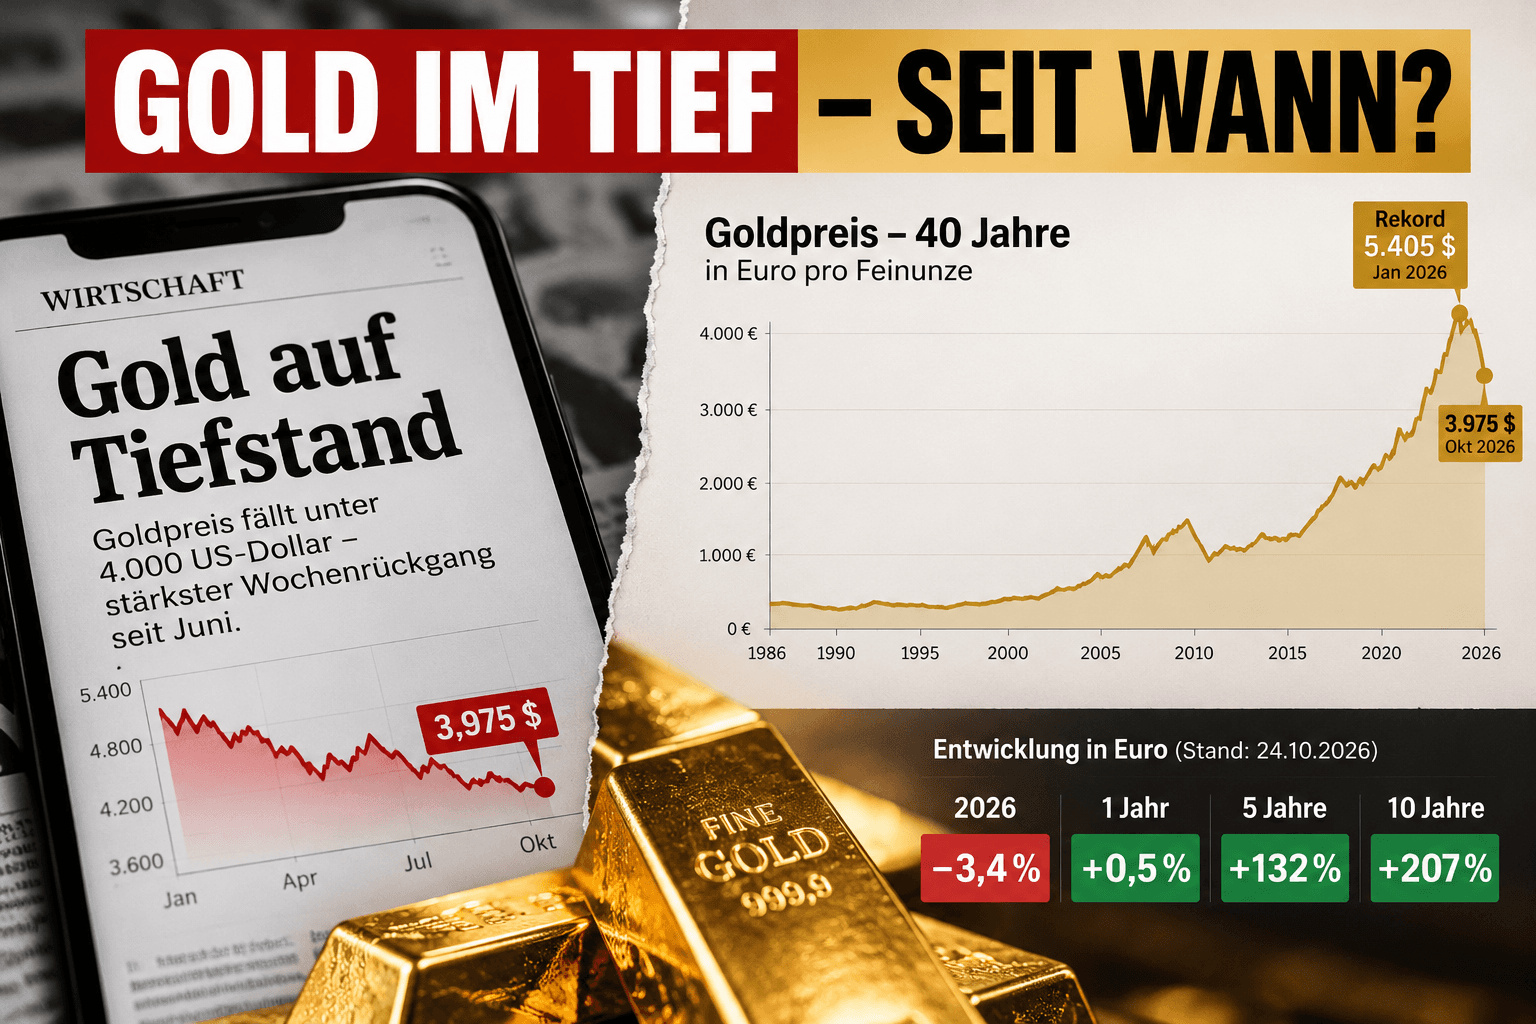
“Gold at a low.” The headline is correct. And at the same time, it can create a completely false impression. On October 23, gold temporarily fell to around $3,975 per troy ounce. A three-month low. Below $4,000. Approximately a four percent decline within one week. Anyone looking only at these figures sees:
falling gold.
Then we open the same chart over ten years. And suddenly we see something completely different. In Euros, gold is currently approximately:
207 percent higher than ten years ago.
Five years: +132 percent. Twelve months: practically unchanged. Which of these stories is true?
All of them.
And that is precisely where the problem lies.
A low requires a timeframe
“Gold at a low point” sounds absolute. But it never is. A price can simultaneously be: a daily high, a three-month low, an annual average, a ten-year high. And on a 40-year chart, still very high up. Therefore, every statement about a high or low should actually automatically include a second piece of information:
since when?
Without this information, a price quote quickly becomes a narrative.
The correction is currently real
Despite all criticism of headlines, this should not be suppressed. On January 29, according to the World Gold Council, gold reached a record level of:
$5,405 per troy ounce.
At the end of September, it was: $4,176. On October 23, gold temporarily fell below: $4,000. Calculated from the record high, approximately:
26 percent
is missing. That is a significant correction.
Anyone who bought gold at the end of January can find little comfort in the fact that the gold price was significantly lower 40 years ago.
Their personal investment horizon possibly began:
in January 2026.
And that is exactly why the time horizon is not an academic question. It determines how investors actually experience a price movement.
But “Gold is crashing” also only tells part of the story
Let us look at the same investment in Euros. GOLD.DE currently shows approximately the following development: 10 years: +206.8 percent 5 years: +131.7 percent 1 year: +0.5 percent 2026: −3.4 percent. Four timeframes. Four completely different stories. The same metal. The same current price.
That is why I like the 40-year chart
It makes visible how strongly headlines are influenced by the choice of their starting point. Whoever starts the story in January 2026 sees a crash. Whoever starts in 2021 sees a massive increase. Whoever starts in 2016 sees more than a tripling. Whoever looks only at the past three months sees a low. And whoever starts yesterday can make almost any movement into a headline.
The starting point determines the story.
This is not only the case with gold.
Bitcoin at $60,000
The same principle can be excellently demonstrated with Bitcoin. $60,000 can be for an investor: a disaster, a fantastic profit, or: a completely uninteresting interim status. The decisive factor is whether you start the comparison at: 20,000, 40,000, 100,000 or any other price. A number possesses surprisingly little explanatory power without a reference point.
But now comes the counter-criticism
A 40-year chart can also appear manipulative. Not necessarily intentionally. But visually.
When an asset rises from a few hundred Euros to several thousand Euros, the most recent fluctuations on the right edge appear almost insignificant.
A decline of 20 or 25 percent suddenly looks like a small blip. For the investor who entered shortly before, however, it is not a small blip.
And the chart shows nominal Euros
This is a second crucial point. 400 Euros in 1986 were economically something completely different than 400 Euros today. Over decades, money loses purchasing power through inflation. The Federal Statistical Office measures this development with the Consumer Price Index. Anyone comparing assets over 40 years should therefore not only ask:
How many Euros has it become?
But rather:
What can I buy with these Euros?
Nominal return and real return are not the same.
And this is precisely where gold actually becomes interesting
Gold is frequently referred to as a: store of value. This does not mean: The gold price must rise every year. Or: Gold must beat inflation every year. Gold has experienced long phases in its history in which investors had to accept real losses. One should not argue that away. The long-term question is rather:
How has the purchasing power of a physical gold holding developed over very long periods of time?
That is a different question than: “What will gold do next week?”
2026 demonstrates this difference particularly well
Gold started spectacularly. In January, the price rose to record levels. In the summer, it fell back below $4,000 at times. A strong increase followed in August. September: −8.5 percent. October: renewed pressure. The gold price was anything but stable in 2026. Anyone who equates gold with a:
“stable price”
therefore misunderstands gold.
Why is gold falling right now?
In September, yields on ten-year US Treasury bonds rose significantly. Simultaneously, the Dollar grew stronger. Both weigh on gold. Because gold pays:
no interest.
The more attractive interest-bearing investments appear, the higher the opportunity costs of a gold position become. Added to this was the reduction of speculative futures positions. On October 23, rising oil prices further exacerbated the situation. Higher oil can increase inflation. Higher inflation can prevent interest rate cuts or make new interest rate hikes more likely. Higher interest rates are often a short-term headwind for gold. The correction therefore has quite understandable causes.
And yet, investors bought gold ETFs
This is perhaps the more interesting story. In September: Gold price: −8.5 percent. Simultaneously, there were inflows into global physically backed gold ETFs of:
10 billion dollars
or approximately:
67 tonnes of gold.
This shows: Price movement and long-term or strategic demand do not always have to move in the same direction. Different market participants possess different time horizons. A short-term trader can sell. A long-term investor can buy at the same time. A central bank, in turn, can pursue completely different goals.
And that is exactly why “the market” is not a single person
Sometimes we speak about it as if the market had an opinion. “The market is losing confidence.” “The market is fleeing gold.” “The market is buying gold.” Yet a market consists of millions of decisions. With different: time horizons, goals, constraints, risks, and expectations. This also explains why a falling price does not automatically mean:
Nobody wants gold.
And a rising price does not automatically mean:
Everyone wants gold.
A gold bar knows no chart
That sounds banal. But for the gold savings perspective, it is important. A physical gold bar does not know: whether today is Friday, whether the Fed is meeting next week, whether an analyst is lowering a price target, or whether a headline is currently speaking of a “crash.” It is: a specific quantity of physical gold. Its market value fluctuates. Sometimes considerably. Its physical quantity does not.
Therein lies the difference between price and asset
Whoever looks exclusively at the price sees: $4,000. $5,400. $3,975. Whoever looks at the asset sees:
one troy ounce of gold.
Both belong together. The error only begins when one considers only one side. Gold does not possess a “true” price of $5,400. But $4,000 is also no proof that its long-term value has disappeared.
This is exactly why I consider extremes to be problematic
On one side: “Gold is crashing – get out.” On the other: “Gold always rises in the long term – just buy.” Both are too simple. Gold can correct massively. Gold can disappoint for years. Gold pays no interest. Storage costs money. And yet, gold can possess a special function within a diversified portfolio. Because physical gold:
is not a claim against a debtor.
That is why another question is decisive for me
Not:
“Is gold currently at a low?”
But rather:
“For what period of time am I holding gold at all?”
Three days? Three months? Three years? 30 years? Whoever looks at the same investment with different horizons gets different answers. And that is exactly why serious financial communication always requires: Price + Timeframe + Currency + Purchasing Power. If one of these points is missing, part of the story is missing.
Perhaps we should therefore read financial headlines differently
When it says:
“Gold at a low”
the first question should be: Which low? Three-month low? Annual low? Ten-year low? Real? Nominal? Dollar? Euro? And if someone instead shows a 40-year chart: likewise ask:
Why exactly 40 years?
Because long-termism can also be framing.
The best contextualization requires both images
Yes: Gold is around 26 percent below its January record. And yes: In Euros, gold stands around 207 percent above the level of ten years ago. Both are true at the same time. Perhaps the most important insight lies precisely there. Not: One chart is right and the other is wrong. But rather:
A chart is always only a snapshot.
And investment decisions should, if possible, not be made on the basis of a snapshot. Because the headline tells us what happened yesterday. The long chart tells us what has happened over decades. The truly important question remains:
What should this asset achieve for us tomorrow?
Stay far-sighted.
Yours,
Helge Peter Ippensen
Note: This post is for informational purposes only and does not constitute investment, tax, or legal advice, nor an invitation to buy or sell precious metals or financial instruments.
Ready to try Spargold?
Invest easily in physical precious metals.